Trade rationale
Other – Study mentioned in Notes Below
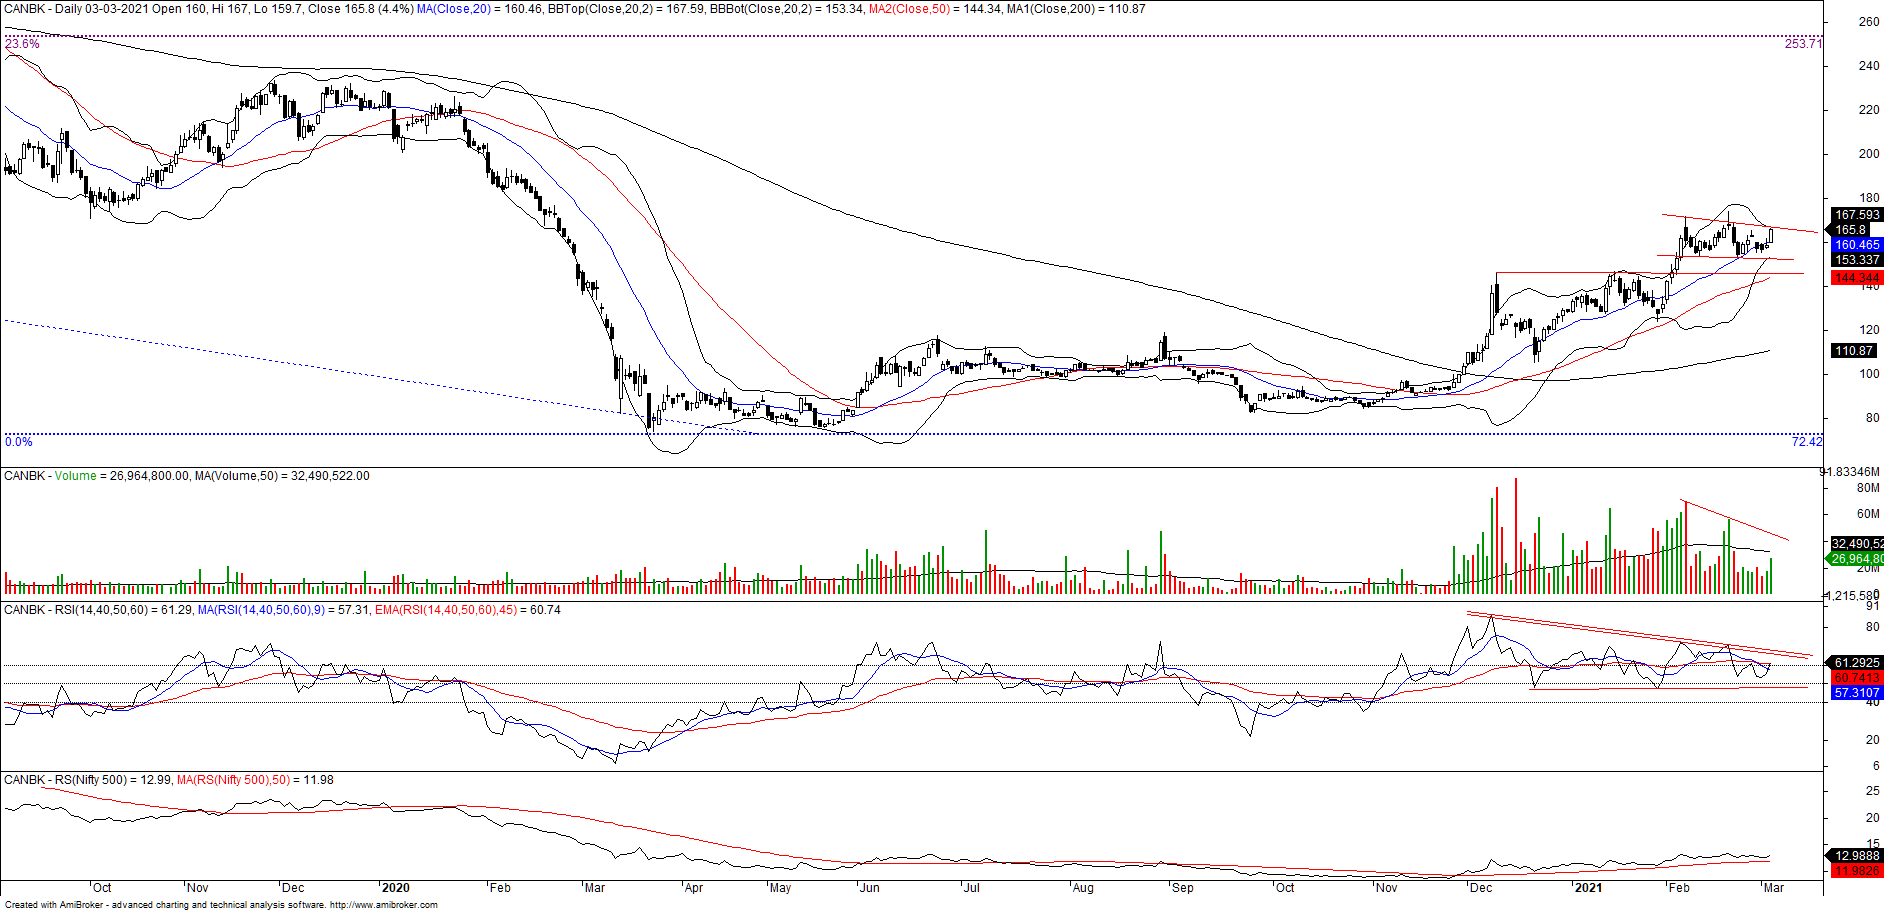
After a steep rise in the stock, the stock took its time to digest its recent gains forming a good consolidation pattern over the daily chart. The decline in volume signifies selling pressure is being abosrbed silently. RSI is also forming a triangle and RS (W.r.t to Nifty 500) is above its 50 SMA, which signifies buying interest in the stock. The ratio chart of PSU Banks with respect to Nifty 500, shows a gain of momentum so a move in Canara bank is likely which may lead to the target of 200 and then 229 (where weekly 200 SMA is placed)