Trade rationale
Other – Study mentioned in Notes Below
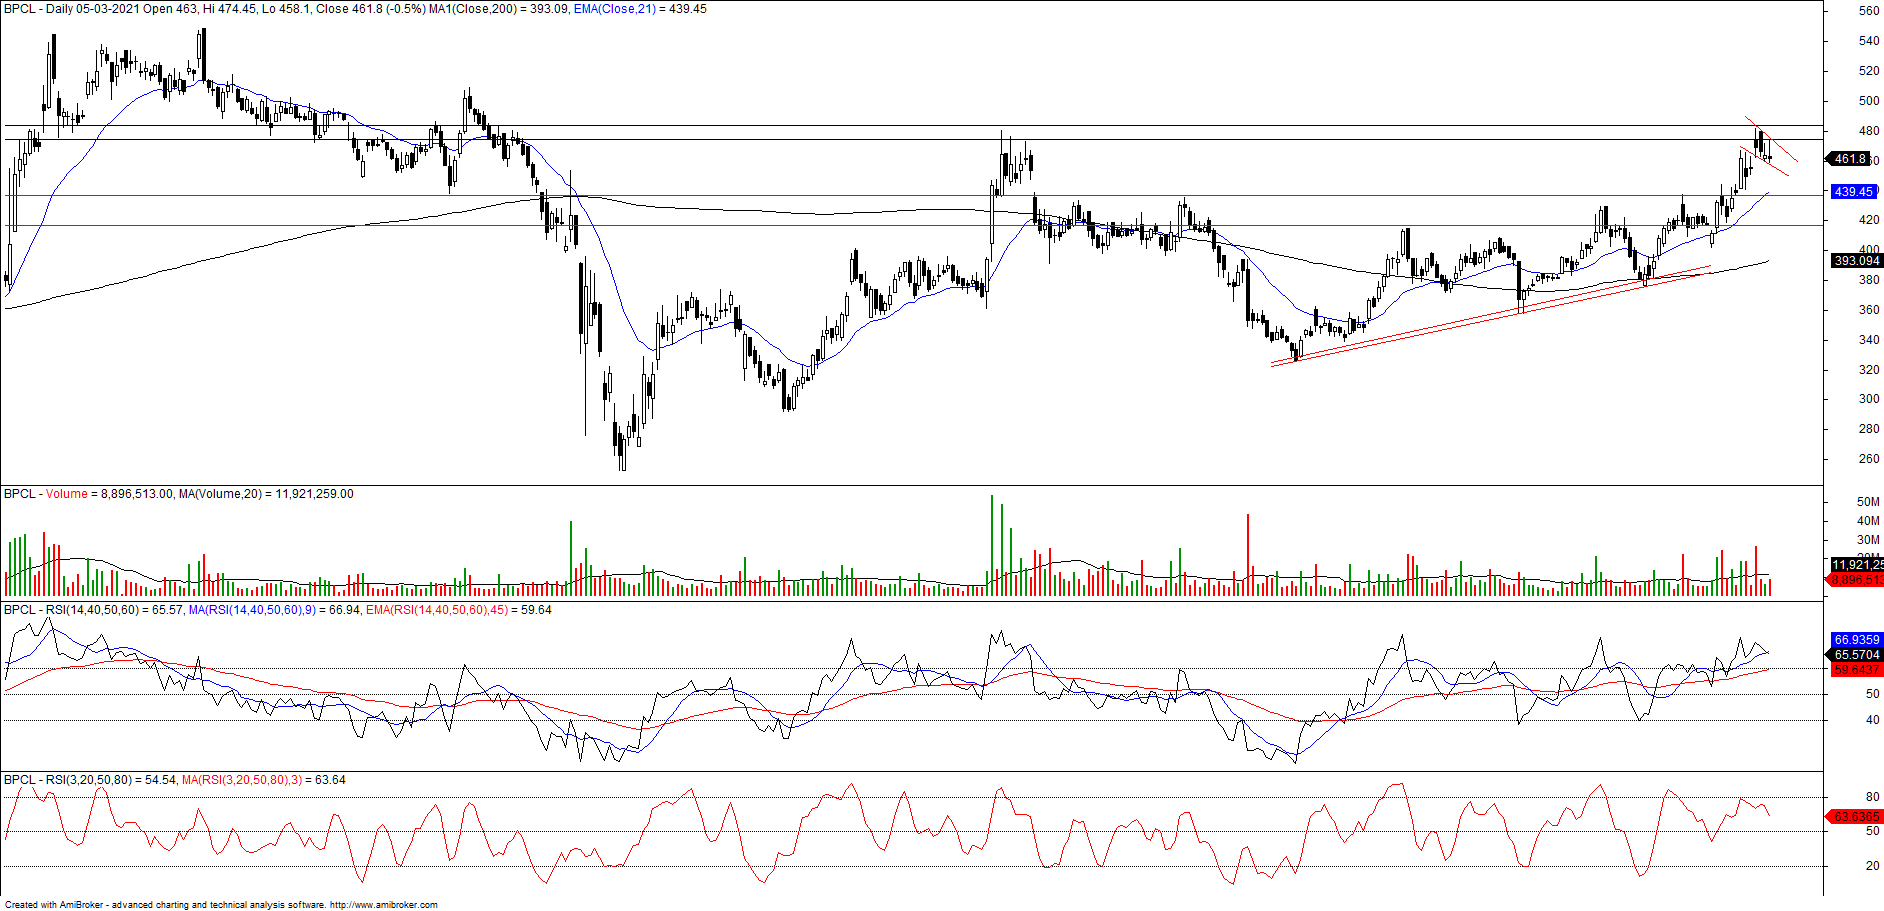
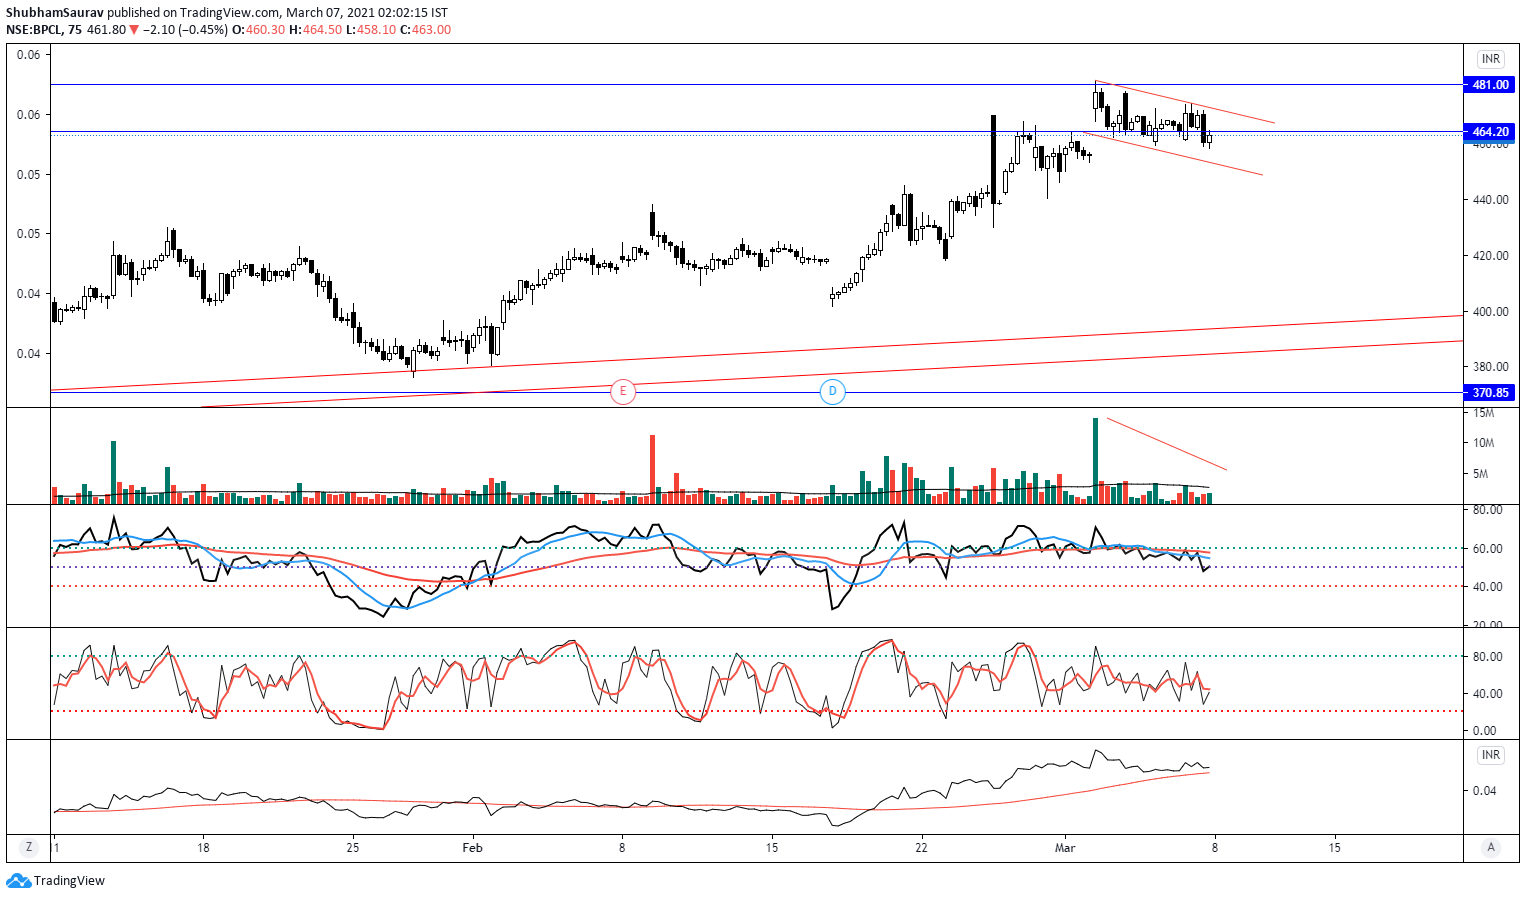
Recently, price broke out from a good ascending triangle and after giving a sharp rise, it is digesting the recent gains and forming a flag and a pole pattern near a supply zone. If we look at 75 minutes chart then we may notice the RS indicator is above its 50 SMA which means it is outperforming the broader market, which signifies buying strength, even when headline indices were weak on Friday. Price sustaining above 480 levels can lead to a price target of 550