Trade rationale
Other – Study mentioned in Notes Below
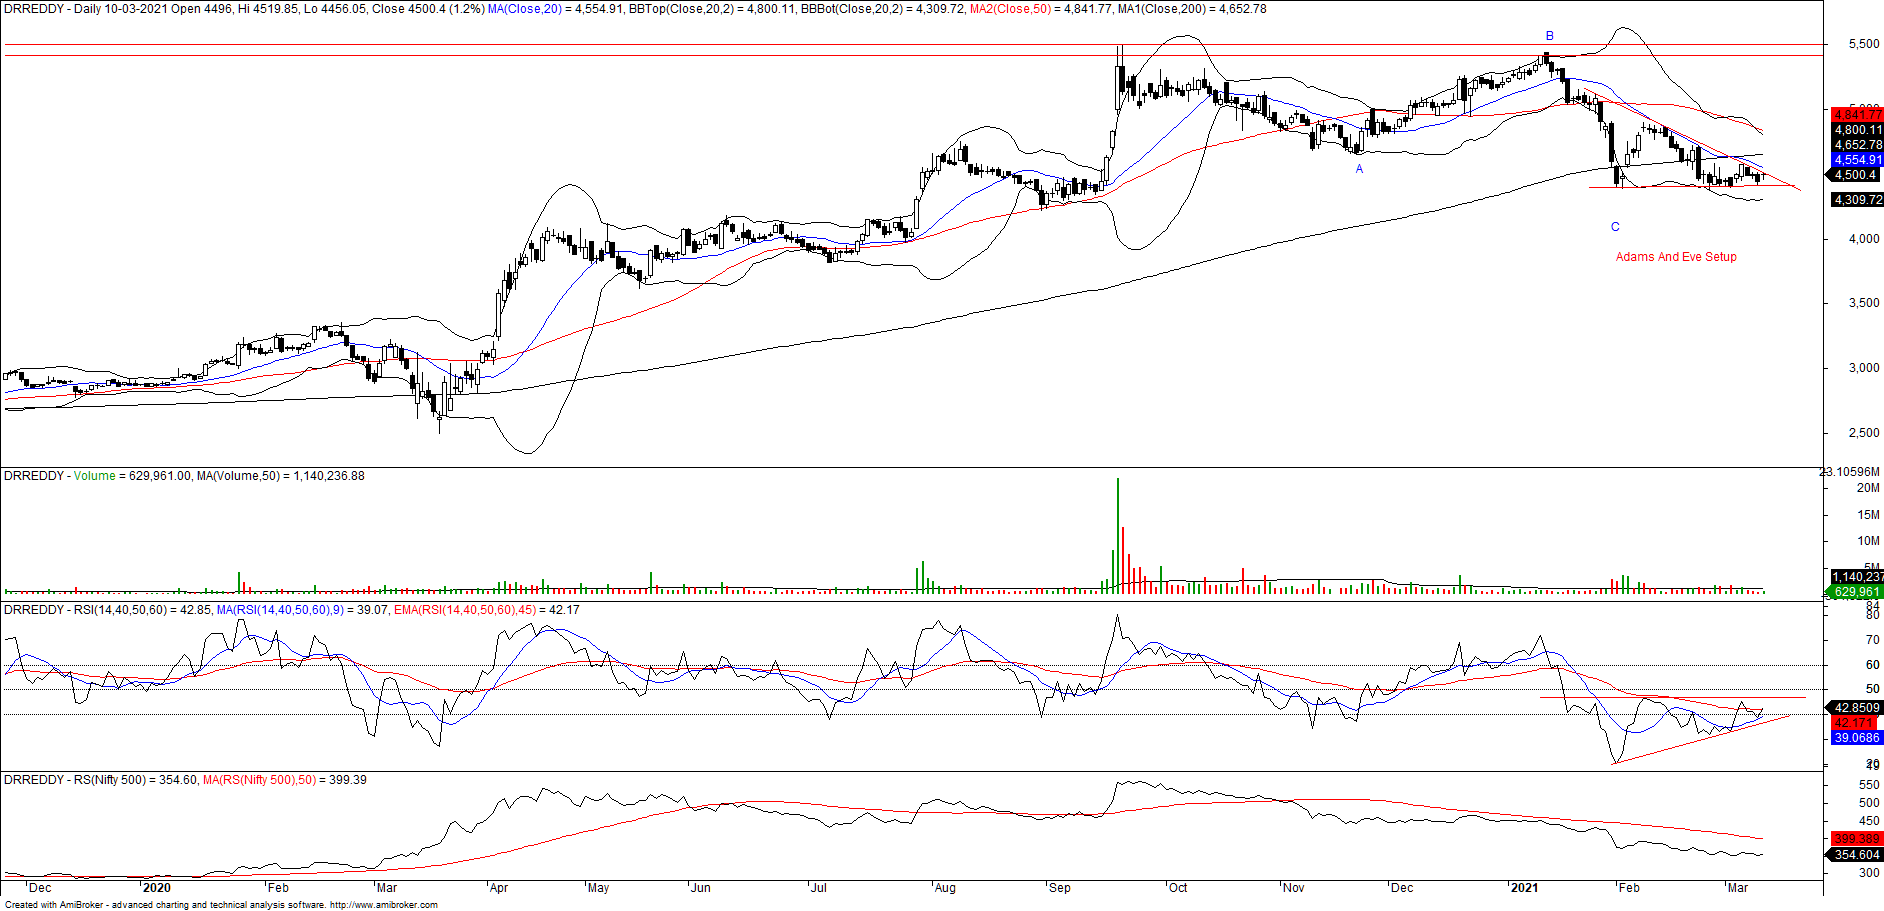
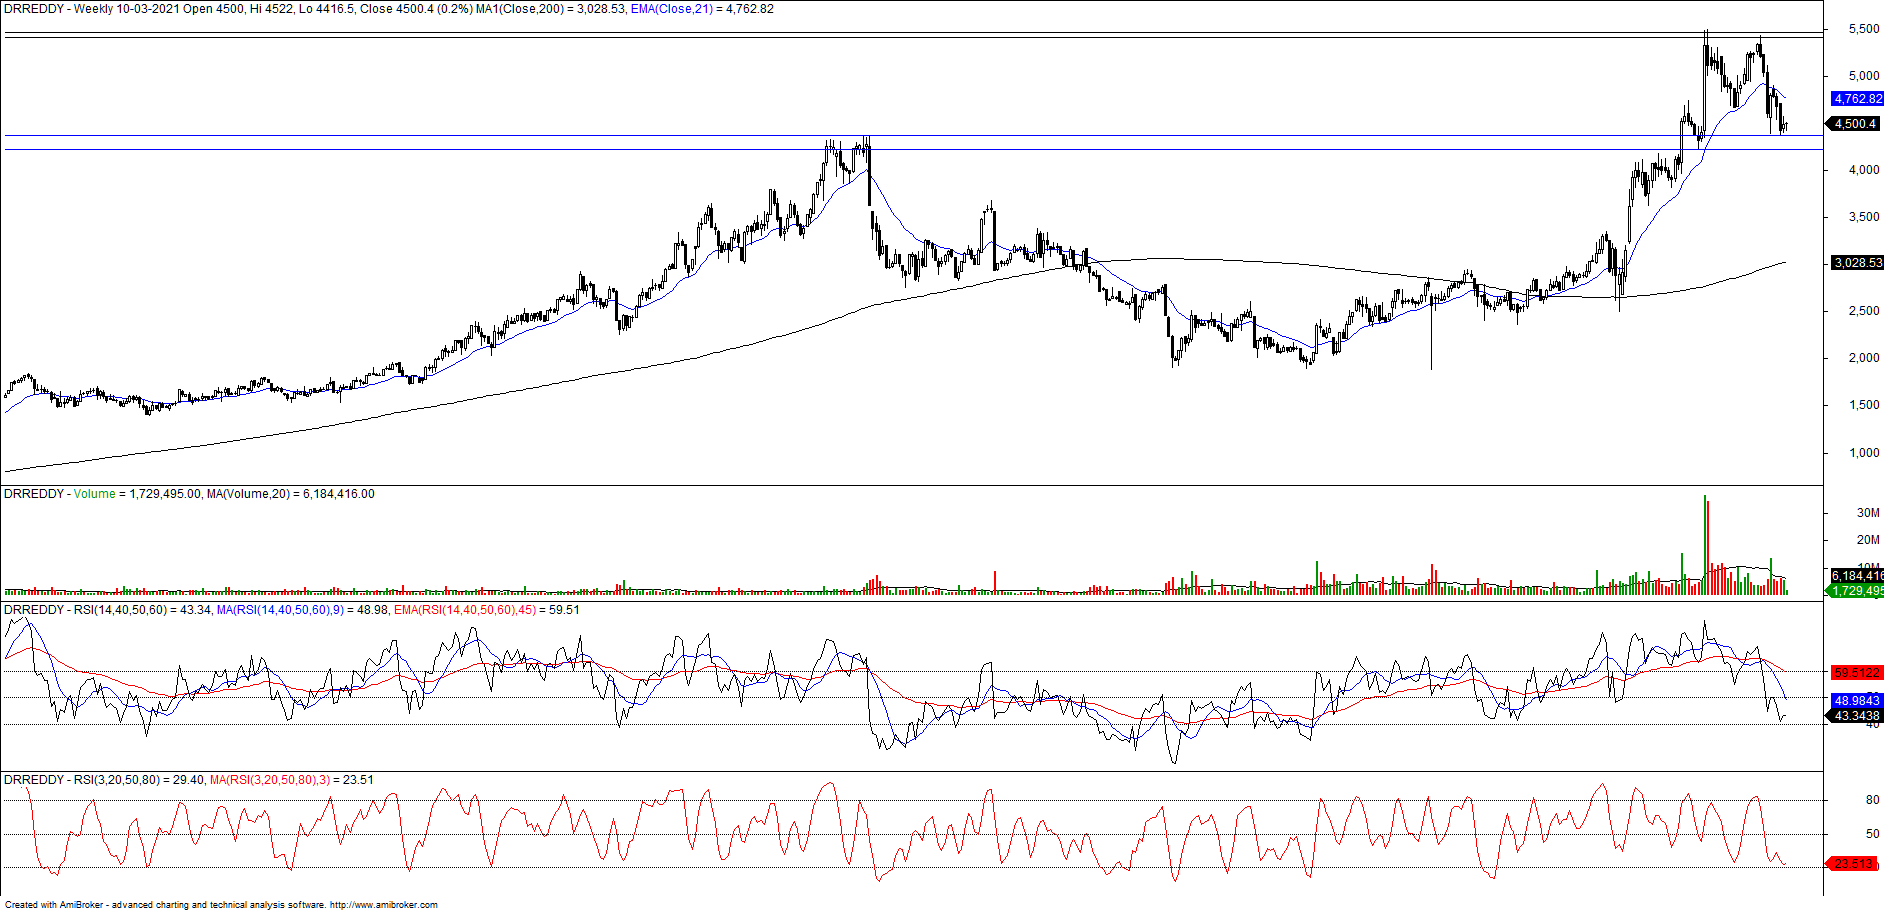
Currently, the price is testing the breakout zone of 2015 high on the weekly chart and RSI is bouncing at 40 levels on the weekly chart. When we come at the daily chart there is bullish divergence over RSI along with diminishing volume which signifies selling is being silently absorbed. Price has formed Adams and Eve setup at the support (prior resistance).